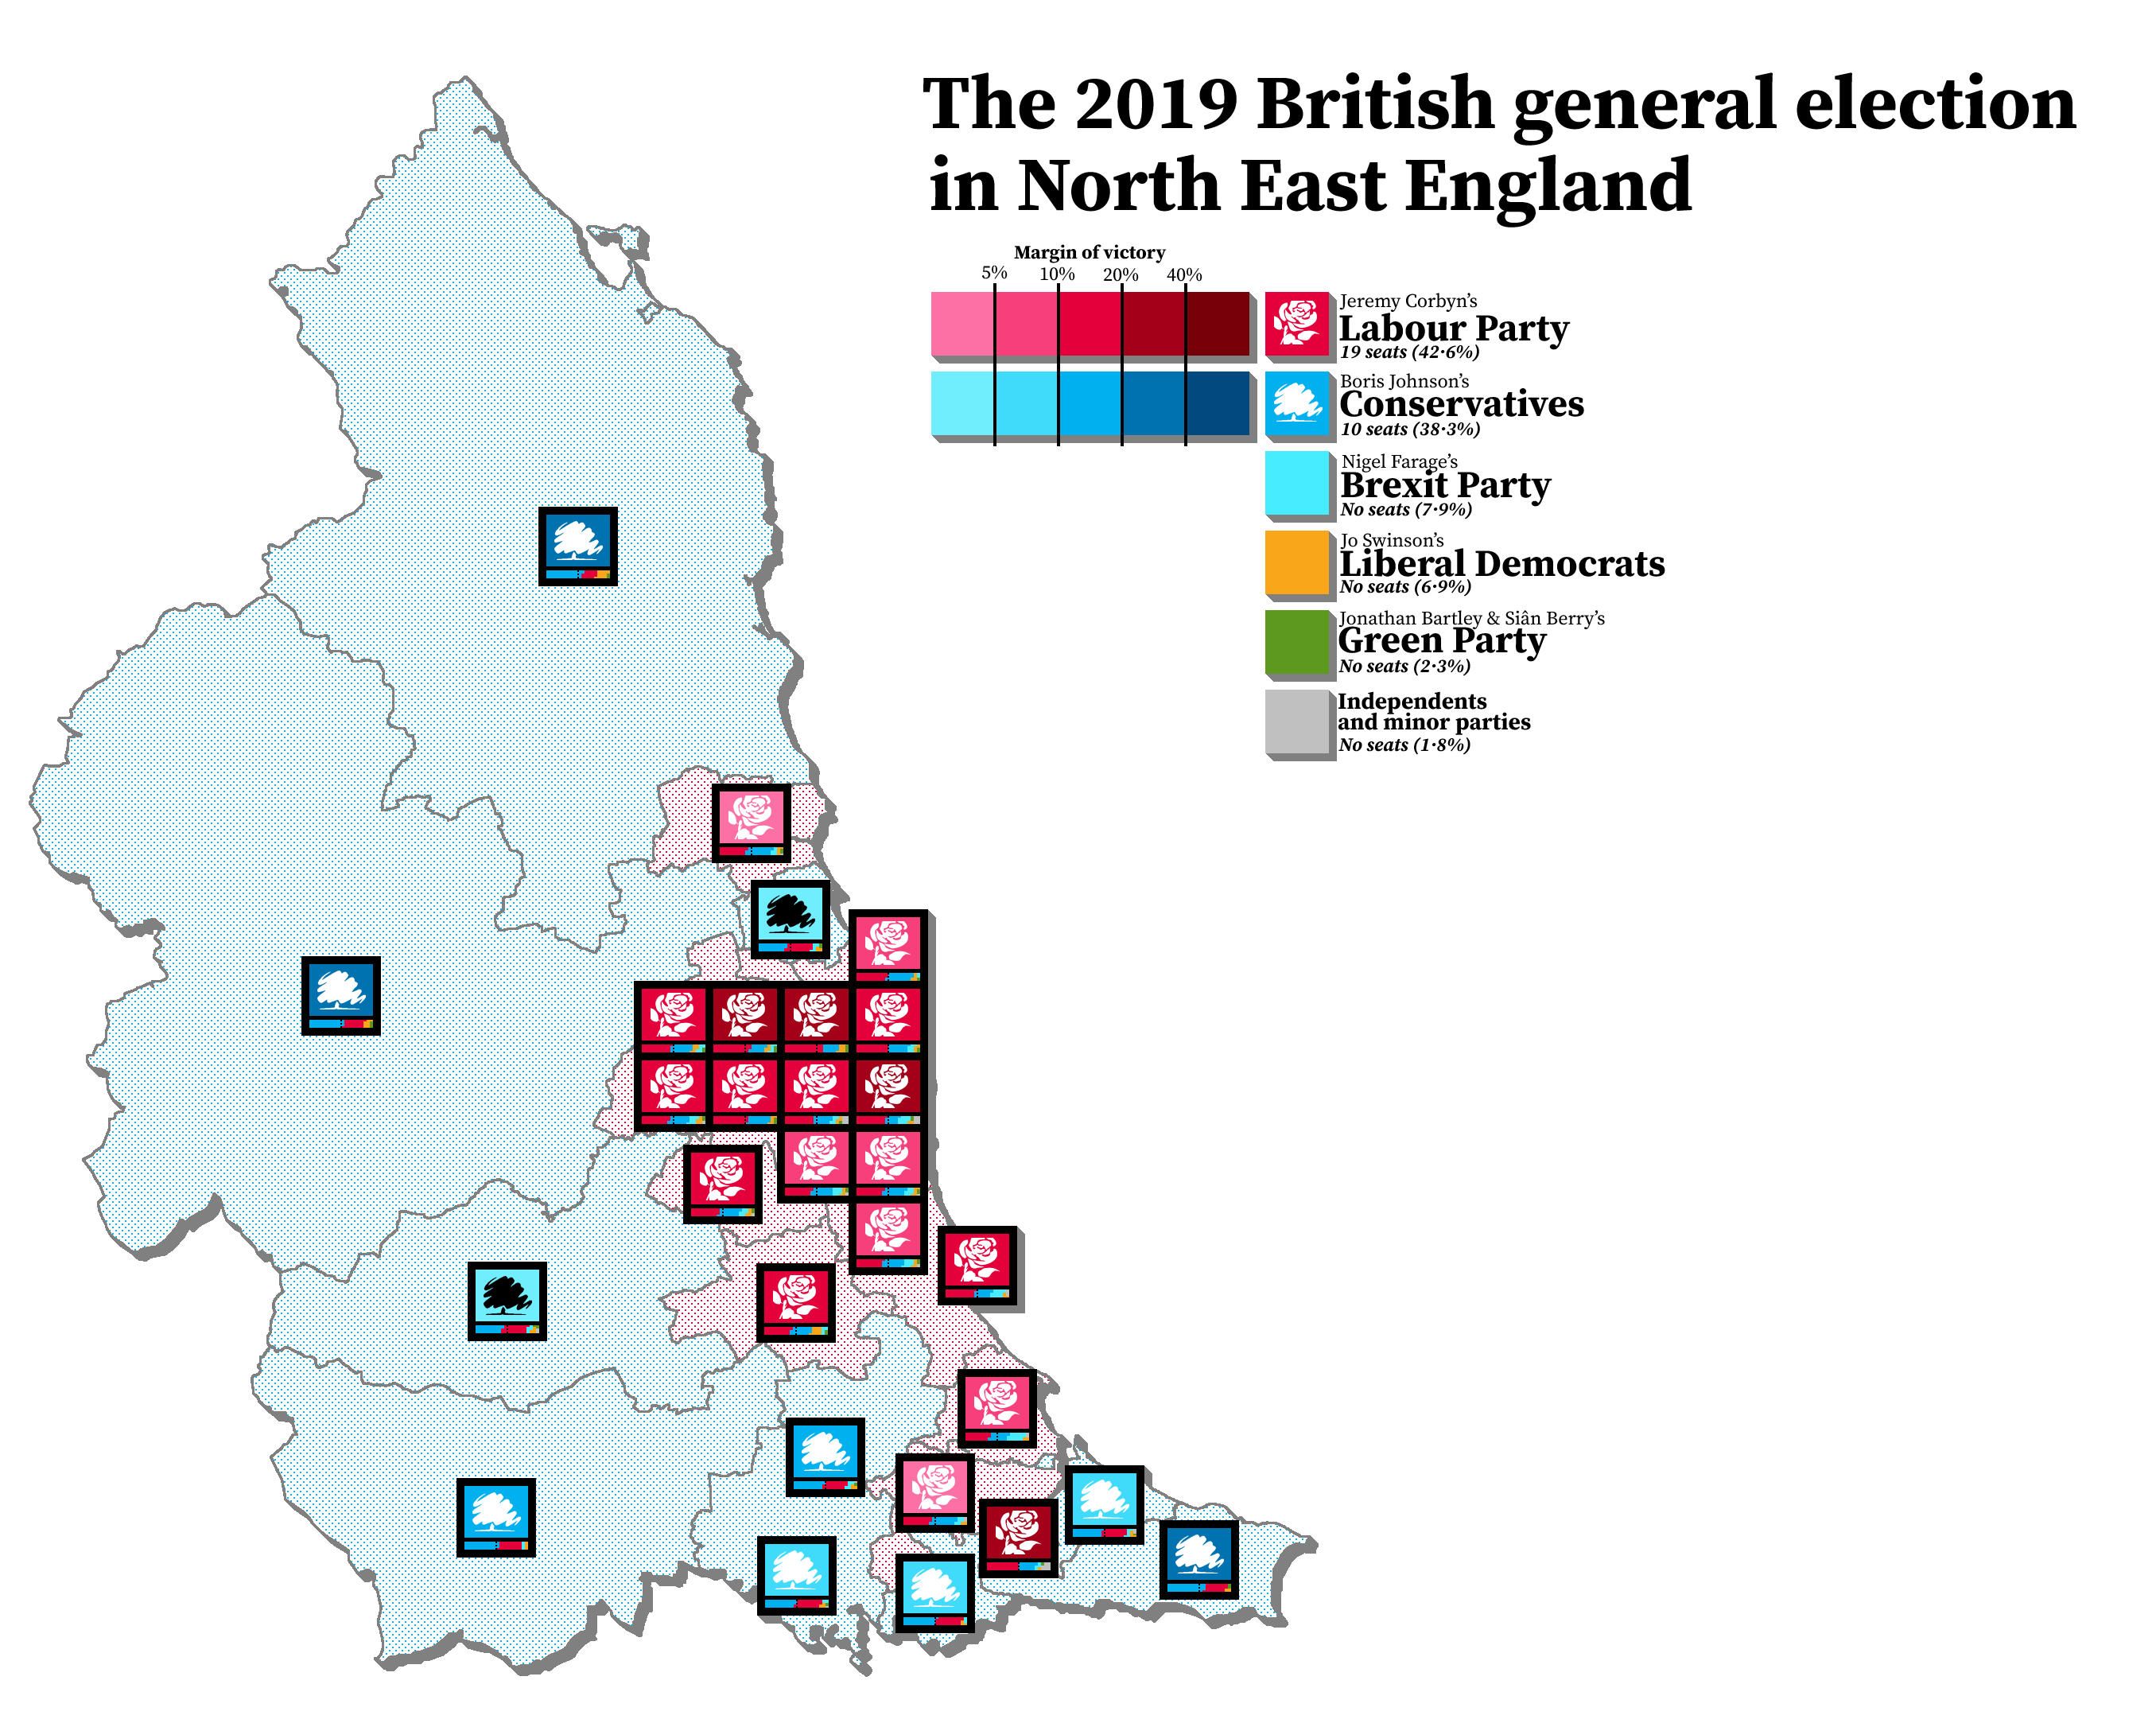
I’ve been terribly bored recently, and have been occupying myself by trying out a way i came up with of mapping out elections — a compromise of sorts between geographic maps (which don’t always show the whole picture) and cartograms (which tend to be butt-ugly).
I chose to map out 2019’s results in the North East to get a feel of things:
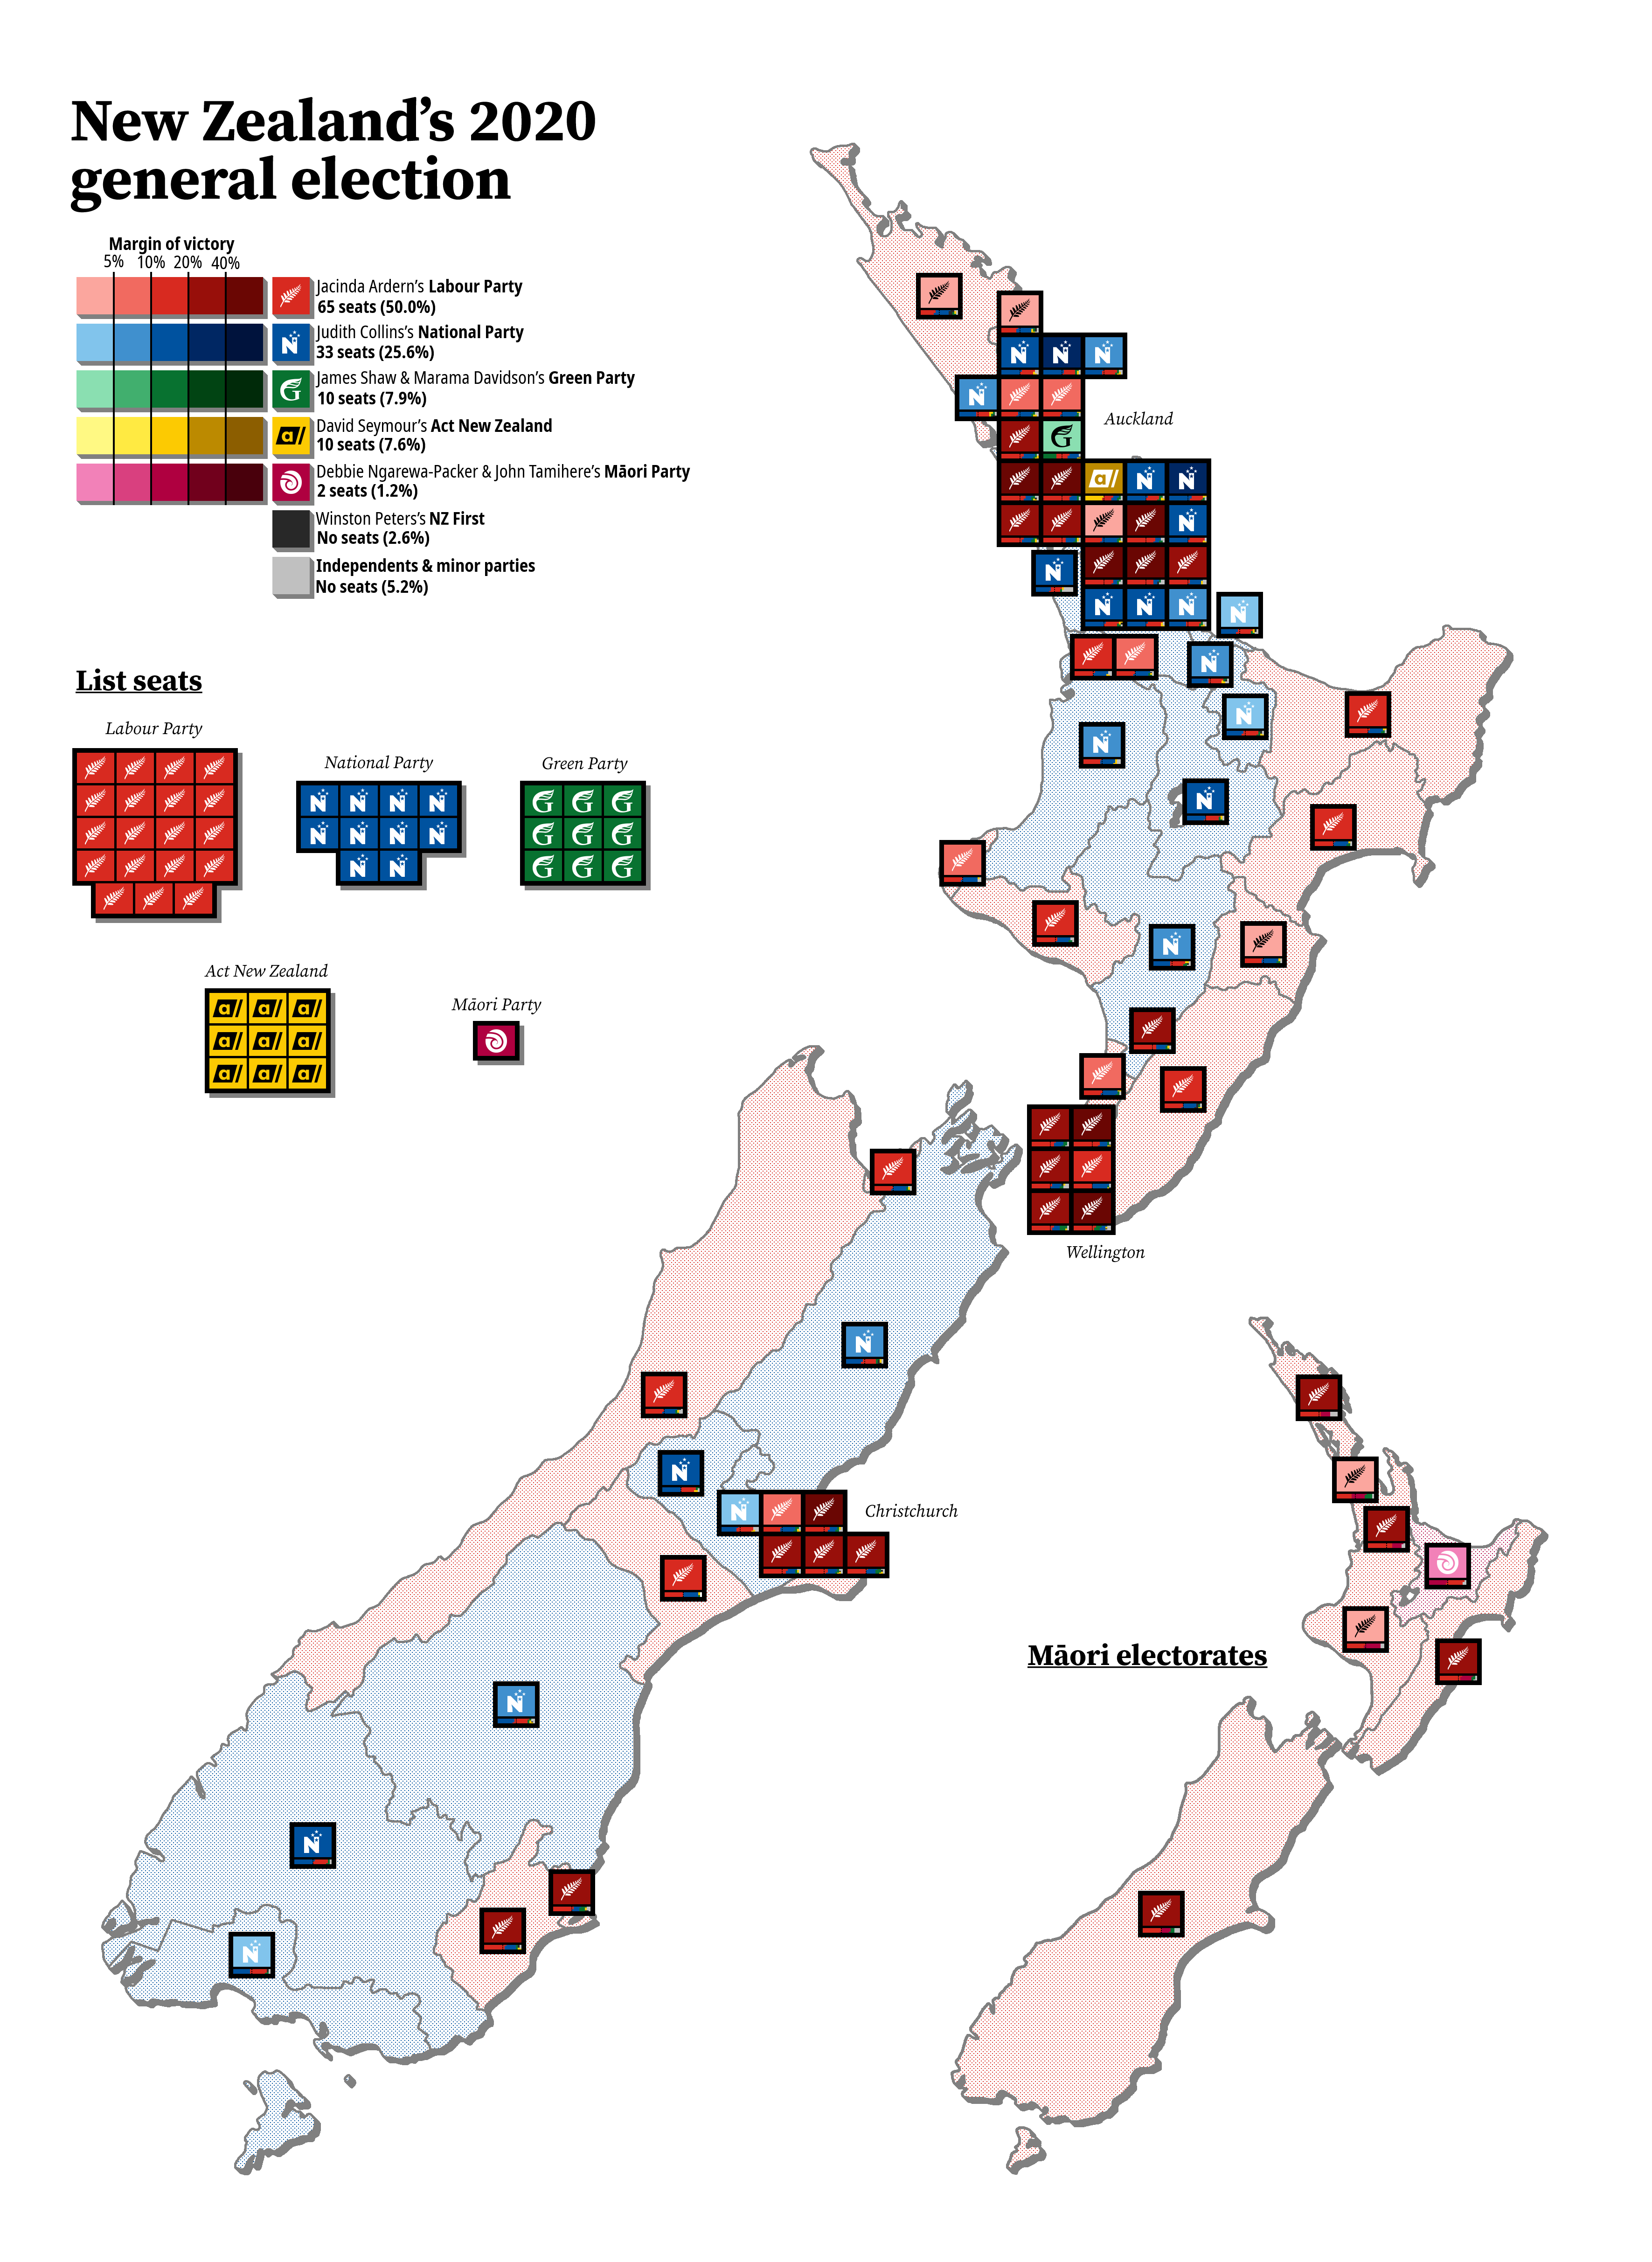
New Zealand is relatively small, so i figured it would be the best choice for the first full country:
And, finally, the most recent council election in good old Northumberland1: